Hi Sitecorians,
It’s been very long since, I last blog. But the wait is over and I am here with some of my learning while upgrading our Siteore platform from 9.3 to 10.2( latest and greatest). With this project, there are lots of learning and I’ll try to share it with you community.
The Issue
After deploying the customisation on top of the vanilla Sitecore 10.2 (huge applaud to Developers of Sitecore and the vibrant community to create and maintain the Docker sample repository), the first obvious step is to do a quick sanity test to check whether or not anything is broken??…. and the unexpected happens, one of the custom written pipeline code was complaining and logging errors in the CM log file.
So the next best handy tool for a developer in Dot Net world is the .Net debugger( thank God). While, I was trying to attache to w3wp process of CM container the following error appeared.

Unable to connect to the Microsoft Visual Studio Remote Debugger named 'XXX.XXX.XXX.XXX'. The Visual Studio 2022 Remote Debugger (MSVSMON.EXE) does not appear to be running on the remote computer. This may be because a firewall is preventing communication to the remote computer. Please see Help for assistance on configuring remote debugging.
The Solution
As per the error message above, it’s clear, there is something not right with the MSVSMON.EXE.
Immediately fire up following PowerShell commands to look into running processes under the CM container.
PS> Docker exec -it <<CM Container name/id>> powershell
PS> Get-Process
The output of the Get-Process command was not showing any currently running process with name msvsmon. uuhhhh… that is the issue, I guess…!!!
So to get the .Net remote debugging working on the CM container, I did checked how we had it working in our 9.3 sitecore Docker Environment. Found 3 different steps to get it working. I wanted to document is in my diary but did not got chance. It is never to late.
Lets have a look at those 3 steps one after another.
Step 1.
Open the docker-compose.override.yml file, add below line under the volumes
 cm:
    image: ${REGISTRY}${COMPOSE_PROJECT_NAME}-xp0-cm:${VERSION:-latest}
    build:
      context: ./docker/build/cm
      args:
        BASE_IMAGE: ${SITECORE_DOCKER_REGISTRY}sitecore-xp0-cm:${SITECORE_VERSION}
        SPE_IMAGE: ${SITECORE_MODULE_REGISTRY}sitecore-spe-assets:${SPE_VERSION}
        SXA_IMAGE: ${SITECORE_MODULE_REGISTRY}sitecore-sxa-xp1-assets:${SXA_VERSION}
        TOOLING_IMAGE: ${SITECORE_TOOLS_REGISTRY}sitecore-docker-tools-assets:${TOOLS_VERSION}
    volumes:
     - ${REMOTEDEBUGGER_PATH}:C:\remote_debugger:ro
Step 2.
Next step to add the REMOTEDEBUGGER_PATH variable to the .env file. To do so open your .env file in VS Code or your choice of text editor and add below line to it.
REMOTEDEBUGGER_PATH=C:\Program Files\Microsoft Visual Studio\2022\Professional\Common7\IDE\Remote Debugger\x64
Now, you need to change the path of debugger folder in above with the VS version you are using. For, now I am using VS 2022 Professional but we have some developers still using VS 2019 Professional for them the path will be C:\Program Files (x86)\Microsoft Visual Studio\2019\Professional\Common7\IDE\Remote Debugger\x64
Step 3.
Now, in the third and the final step, we will try to execute multiple processes at the entry point for CM container. To do so, I have added few commands to the existing Powershell entry point command.
 cm:
    image: ${REGISTRY}${COMPOSE_PROJECT_NAME}-xp0-cm:${VERSION:-latest}
    build:
      context: ./docker/build/cm
      args:
        BASE_IMAGE: ${SITECORE_DOCKER_REGISTRY}sitecore-xp0-cm:${SITECORE_VERSION}
        SPE_IMAGE: ${SITECORE_MODULE_REGISTRY}sitecore-spe-assets:${SPE_VERSION}
        SXA_IMAGE: ${SITECORE_MODULE_REGISTRY}sitecore-sxa-xp1-assets:${SXA_VERSION}
        TOOLING_IMAGE: ${SITECORE_TOOLS_REGISTRY}sitecore-docker-tools-assets:${TOOLS_VERSION}
    volumes:
      - ${REMOTEDEBUGGER_PATH}:C:\remote_debugger:ro
    networks:
      dev.local:
        aliases:
          - cm.dev.local
    entrypoint: powershell -Command "& Write-Host 'Starting Debugger Service...'; & Start-Process -FilePath 'C:\remote_debugger\msvsmon.exe' -ArgumentList '/nostatus', '/silent', '/noauth', '/anyuser', '/nosecuritywarn', '/wow64port 4026'; & C:\tools\entrypoints\iis\Development.ps1"
With the above alteration firstly, I am writing to host to get to know that it is trying to start debugger service and secondly executing MSVSMON.EXE file with few arguments as Start-Process powershell command.
With the argument wow64port mind that each Visual Studios have their own ports assigned as default debugging port for msvsmon.exe. See the references in section below.
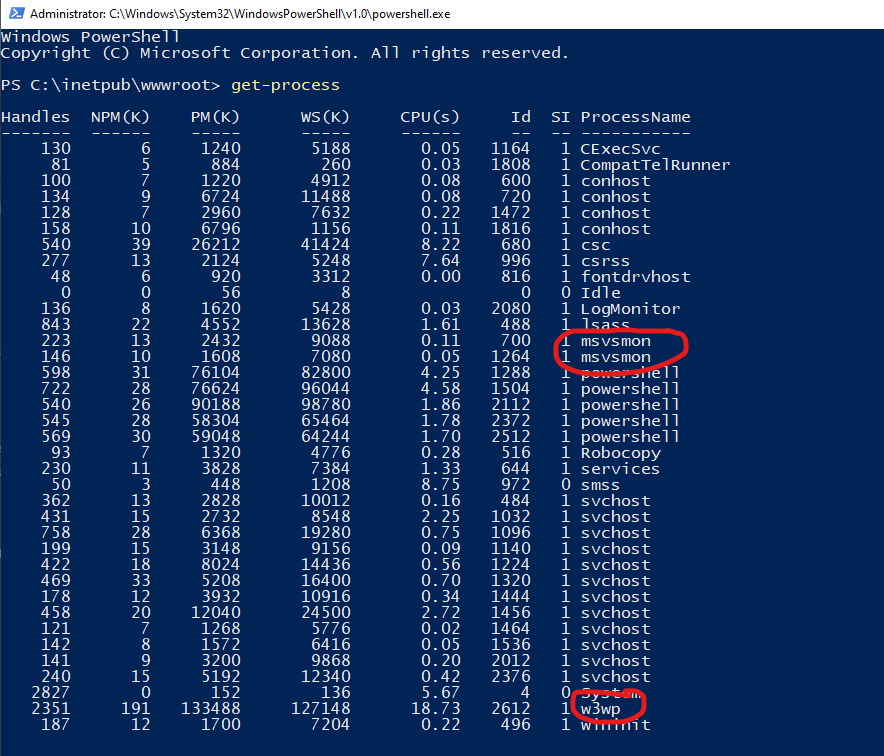
Verification
As verification of both w3wp and msvsmon services running we need to check the output of Get-Process command on CM container
Note
Also make sure in the web.config of your CM container, the debug is set to true for compilation node. configuration/system.web/compilation[debug=’true’]
Note
Notice that I am using (;) semicolon as the command terminator for powershell command. If you are using CMD, use & (ampersand)
References
https://docs.microsoft.com/en-us/visualstudio/debugger/remote-debugger-port-assignments?view=vs-2022
